|
Recently released statistics by the European Patent Office (EPO) confirm a trend that we have noticed over the past 10 years: Asian patentees, specifically Taiwanese and Chinese, are waking up and exploring the possibilities of the European market.
As one of the leading patent prosecution firms in Taiwan, NAIP has helped promote this growth. Since 2000 NAIP's European patent applications have grown at a faster rate than Taiwan's overall rate and, based on recent statistics, currently we manage approximately 10% of Taiwan's EPO applications.
EPO Patent Applications -2000 to 2009
The following is a selection of data released by the EPO showing total patent applications:
|
2000 |
2001 |
2002 |
2003 |
2004 |
2005 |
2006 |
2007 |
2008 |
2009 |
Germany |
20057 |
21170 |
20893 |
22620 |
22919 |
23630 |
24811 |
25185 |
26667 |
25107 |
China |
162 |
190 |
226 |
338 |
441 |
556 |
726 |
1126 |
1503 |
1631 |
Japan |
17117 |
19871 |
15958 |
18570 |
20635 |
21491 |
22178 |
22934 |
23104 |
19933 |
Rep. Korea |
977 |
1181 |
1427 |
2082 |
2877 |
3861 |
4613 |
4950 |
4348 |
4193 |
US |
28350 |
30413 |
30061 |
31776 |
32402 |
32558 |
34605 |
35469 |
37234 |
32966 |
Taiwan |
261 |
331 |
447 |
512 |
596 |
714 |
807 |
796 |
1077 |
1006 |
Taiwanese Applicants:
Only recently have Taiwanese companies shown interest in obtaining European patents. Looking at (Fig. 1) below, which indicates the percentage increase in the number of applications filed with the EPO by Taiwanese applicants, the number has leaped from 261 applications in 2000 to 1077 applications in 2009. Taiwan has had steady year-on-year increases in applications filed with the EPO – the exceptions being 2007 and 2009, which can be contributed to economic meltdowns.
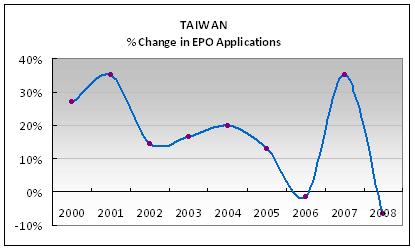
Fig. 1: Percent Change in Patent Applications for Taiwanese Applicants
Chinese Applicants:
China on the other hand, started off with only 162 applications in 2000 (99 applications fewer than Taiwan), but has outdone Taiwan in applications filed with the EPO since 2007. Also, China is also the only country listed above that, despite the economic meltdown, has maintained its year-on-year increases in applications filed, (Fig. 2).
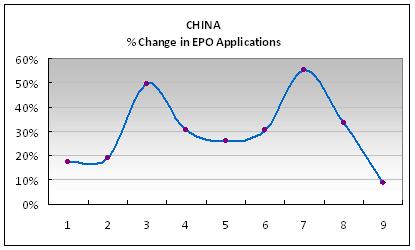
Fig. 2: Percent Change in Patent Applications for Chinese Applicants
EPO Patent Grants -2000 to 2009
|
2000 |
2001 |
2002 |
2003 |
2004 |
2005 |
2006 |
2007 |
2008 |
2009 |
Germany |
5392 |
8120 |
11246 |
13406 |
13607 |
12487 |
14275 |
11933 |
13496 |
11384 |
China |
11 |
10 |
26 |
50 |
66 |
80 |
115 |
136 |
271 |
351 |
Japan |
5499 |
6579 |
8250 |
10294 |
10411 |
9549 |
12044 |
10651 |
10917 |
9439 |
Korea |
164 |
171 |
250 |
367 |
460 |
486 |
787 |
858 |
1201 |
1094 |
Taiwan |
20 |
32 |
50 |
65 |
117 |
136 |
165 |
149 |
263 |
201 |
US |
7436 |
8586 |
1182 |
15090 |
14208 |
13004 |
14833 |
12503 |
12733 |
11352 |
| Fig 3. Patents Granted by the EPO: 2000 – 2009 |
Figure 3 shows that the number of patents granted by the EPO to Taiwanese applicants has steadily increased from 20 in 2000 to 201 in 2009. Taiwan's growth is second only to China, who has grown from 11 patents granted in 2000 to 351 in 2009.
Please note that, tempting as it may be, it is not possible to compare grants with applications as we do not have the statistical data needed to trace the success rate of each application. Generally speaking, the EPO grants approximately 50% of all applications.
The Big Picture
Having a look at the bigger picture (Fig 4), Taiwan and China are still minorities compared to the major players at the EPO – the United States, Germany, and Japan respectively. Korea files nearly triple that of China, but far less than the BIG 3 (US, Germany, and Japan).
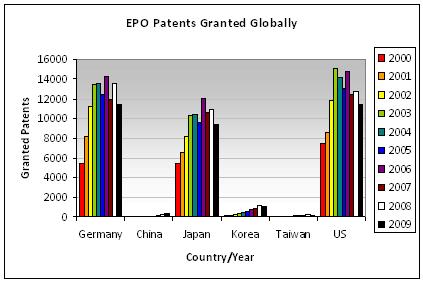
Fig. 4: European Patent Applications Globally
Although the numbers might seem insignificant at first, this growth trend signals a rising awareness among Taiwanese and Chinese companies of the importance and potential value of patent protection in Europe. In the past the numbers were likely low because Taiwanese companies were traditionally focused on the US-market for commercialising their inventions. Now, the shift in roles from passive manufacturers to own-brand companies and exploration of new markets has led them to increase their focus in patents. For China, their delayed entry can likely be attributed to a learning curve in intellectual property rights. In addition, many prospective applicants are put off by the relatively more expensive cost of obtaining a European Patent. Finally, among the many other reasons, a general lack of experience with European Patents may also have contributed to the past apathy.
What is causing this growth? A plethora of possibilities– some of which include: globalization of the world economy; the shift of market resources to Europe due to competition in the US; overall growing awareness of the importance of IP, better quality patents granted by the EPO and so on.
Whatever the reasons, reality dictates that both the number of applications filed with the EPO by Taiwanese and Chinese applicants and the number of patents granted to them have made gains over the past 10 years. At NAIP, we believe that Taiwanese and Chinese companies are finally recognising the market opportunities in Europe and more importantly, are taking action and investing money to secure their European intellectual property rights.
In Search of Effective Filing
| |
2005 |
2006 |
2007 |
2008 |
2009 |
|
Applications |
Grants |
Applications |
Grants |
Applications |
Grants |
Applications |
Grants |
Applications |
Grants |
Germany |
18.36% |
23.45% |
18.32% |
22.74% |
17.81% |
21.82% |
18.18% |
22.57% |
18.66% |
21.91% |
US |
25.30% |
24.42% |
25.56% |
23.63% |
25.08% |
22.86% |
25.39% |
21.29% |
24.50% |
21.84% |
Japan |
16.70% |
17.93% |
16.38% |
19.19% |
16.22% |
19.47% |
15.76% |
18.25% |
14.82% |
18.16% |
Korea |
3.00% |
0.91% |
3.41% |
1.25% |
3.50% |
1.57% |
2.97% |
2.01% |
3.12% |
2.11% |
Taiwan |
0.55% |
0.26% |
0.60% |
0.26% |
0.56% |
0.27% |
0.73% |
0.44% |
0.75% |
0.39% |
China |
0.43% |
0.15% |
0.54% |
0.18% |
0.80% |
0.25% |
1.02% |
0.45% |
1.21% |
0.68% |
| Fig. 5: Total European Patent Applications Globally |
A final interesting note from the data is that, as a percentage of the total number of patents applications at the EPO in 2009, Taiwan's applications represent 0.75% and China's 1.21%, both up from previous years. However, when looking at the actual patents granted, Taiwan's granted patents represent only 0.39% of the total number of patents granted to the countries listed. China's 0.68%.
Germany on the other hand represents 18.66% of the total number of applications filed, but managed to achieve 21.9% of the patents granted. The success rate of other countries is also similar or higher than their application rate.
Does this mean the quality of applications filed by Chinese and Taiwanese companies are of lower quality or patentability than those filed by Germany, US or even Korea? Not necessarily. The figures may be representative of the learning curve associated with implementing IP strategy in a new market. The applicant's may not be familiar with procedures, drafting differences and so on.
That is why it is imperative Taiwanese applicants have access to reliable, quality European patent partner. NAIP provides such a service. Early on we embraced the opportunity to expand our specialized patent filing services to EPO applications. Through ongoing European patent training NAIP has ensured a strong knowledge base among our patent engineers and administrative staff. That allows us to process our clients' European patent applications effectively, focusing on quality above all. Furthermore, to maintain and guarantee high quality patents, we collaborate with a reputable German Patent Firm for the direct filing and prosecution of all of our European Patent Applications.
We believe that through our experience with EPO applications, our thorough consultations with our clients and our attention to detail, our clients can expect a much higher success rate with their EPO applications.
|